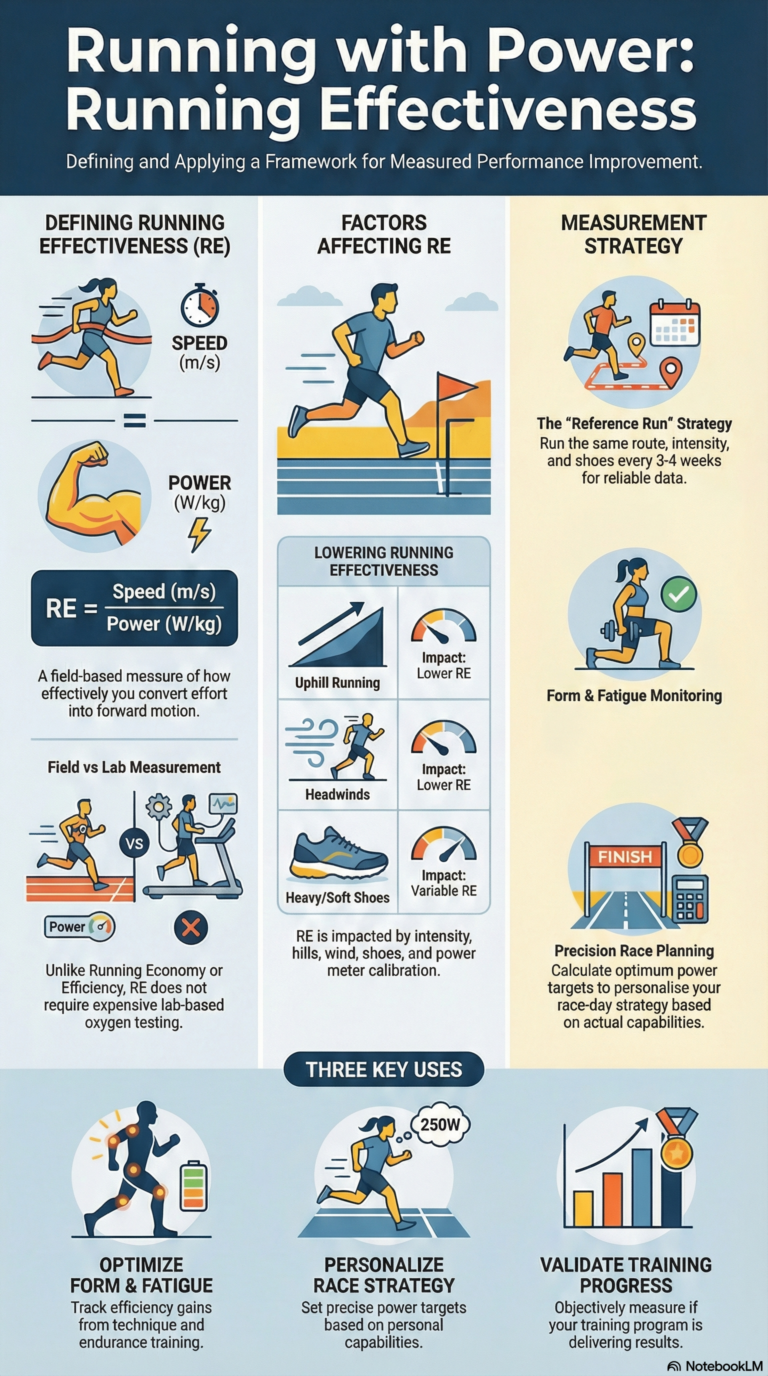
Infographic – Running Effectiveness

𝐑𝐮𝐧𝐧𝐢𝐧𝐠 𝐄𝐟𝐟𝐞𝐜𝐭𝐢𝐯𝐞𝐧𝐞𝐬𝐬 … 𝐚𝐧 𝐢𝐧𝐟𝐨𝐠𝐫𝐚𝐩𝐡𝐢𝐜

Something different this week.

My posts are usually quite short (200-300 words) and deliberately so.

Bitesize, for easy consumption; each a sequence of 5 posts, building throughout the week.

But this week … pictures!

One infographic per day on the core concepts underpinning Running with Power.

𝐖𝐡𝐲 𝐢𝐧𝐟𝐨𝐠𝐫𝐚𝐩𝐡𝐢𝐜𝐬?

I’m curious to see what AI can create from some handwritten posts.

Curious to discover how it presents the concepts.

Curious to see what it includes (and what it leaves out).

Curious to consider what the infographic says about the way I’ve written the content.

𝐄𝐚𝐜𝐡 𝐝𝐚𝐲 𝐭𝐡𝐢𝐬 𝐰𝐞𝐞𝐤

I’ll post an infographic generated by NotebookLM using the phrase “Please generate an infographic using the selected source” … and for days 2 through 5 I add “in the same style as the previous infographic.”

I’ll also include the URL for the source used for the infographic.

And I’d love to hear from you!

What do you think? Does the picture capture the concept? Does it help with understanding? Is it confusing? Could it be improved?

Today’s URL: https://startrunningwithpower.substack.com/p/how-effective-are-you-at-converting

𝑺𝒉𝒐𝒖𝒍𝒅𝒏’𝒕 𝒚𝒐𝒖 𝒃𝒆 𝑹𝒖𝒏𝒏𝒊𝒏𝒈 𝒘𝒊𝒕𝒉 𝑷𝒐𝒘𝒆𝒓?

Questions?
📖 Getting Started

Infographic – Running Effectiveness

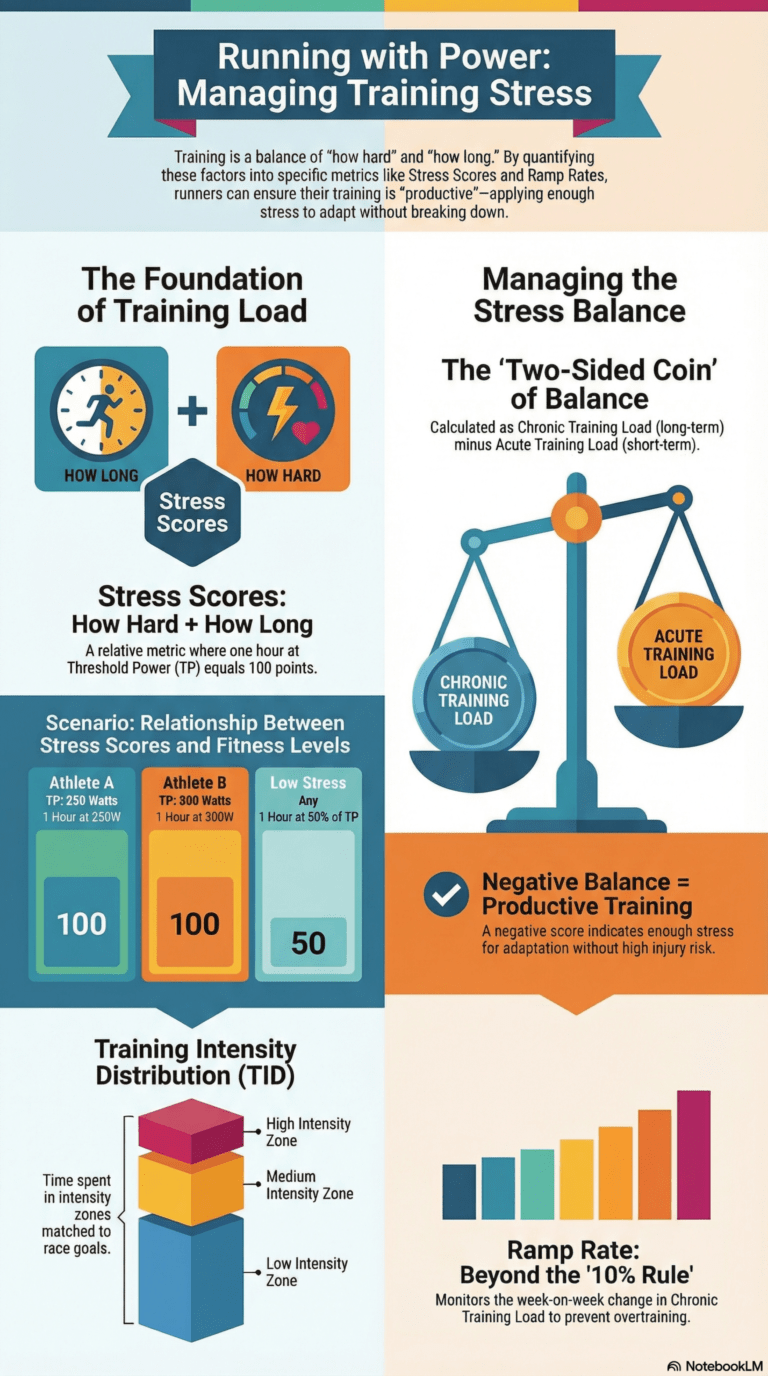
Infographic – Training Stress

Infographic about Training Stress

𝐓𝐫𝐚𝐢𝐧𝐢𝐧𝐠 𝐒𝐭𝐫𝐞𝐬𝐬 … 𝐚𝐧 𝐢𝐧𝐟𝐨𝐠𝐫𝐚𝐩𝐡𝐢𝐜

Something different this week.

My posts are usually quite short (200-300 words) and deliberately so.

Bitesize, for easy consumption; each a sequence of 5 posts, building throughout the week.

But this week … pictures!

One infographic per day on the core concepts underpinning Running with Power.

𝐖𝐡𝐲 𝐢𝐧𝐟𝐨𝐠𝐫𝐚𝐩𝐡𝐢𝐜𝐬?

I’m curious to see what AI can create from some handwritten posts.

Curious to discover how it presents the concepts.

Curious to see what it includes (and what it leaves out).

Curious to consider what the infographic says about the way I’ve written the content.

𝐄𝐚𝐜𝐡 𝐝𝐚𝐲 𝐭𝐡𝐢𝐬 𝐰𝐞𝐞𝐤

I’ll post an infographic generated by NotebookLM using the phrase “Please generate an infographic using the selected source” … and for days 2 through 5 I add “in the same style as the previous infographic.”

I’ll also include the URL for the source used for the infographic.

And I’d love to hear from you!

What do you think? Does the picture capture the concept? Does it help with understanding? Is it confusing? Could it be improved?

Today’s URL: https://startrunningwithpower.substack.com/p/how-can-you-ensure-your-training

𝑺𝒉𝒐𝒖𝒍𝒅𝒏’𝒕 𝒚𝒐𝒖 𝒃𝒆 𝑹𝒖𝒏𝒏𝒊𝒏𝒈 𝒘𝒊𝒕𝒉 𝑷𝒐𝒘𝒆𝒓?

Questions?
📖 Getting Started

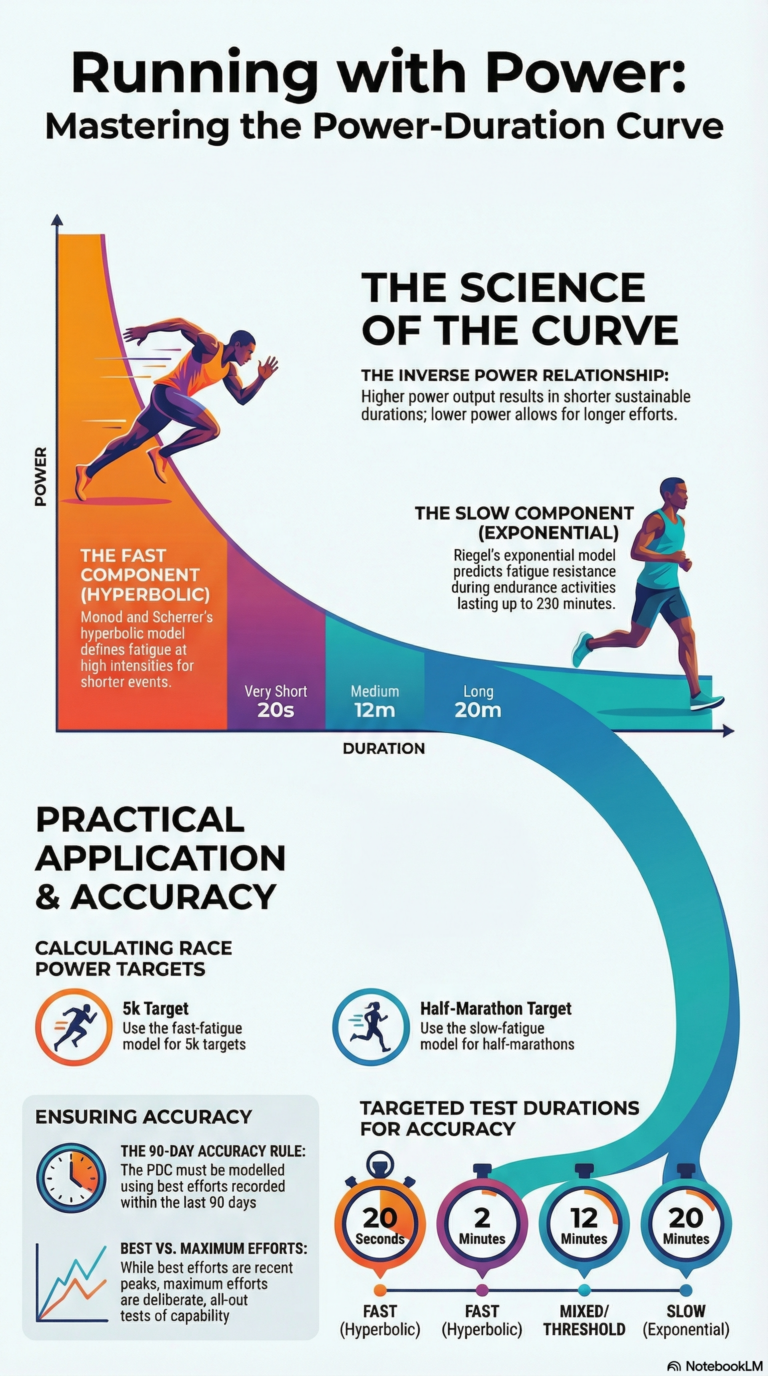
Infographic – Power-Duration Curve

Infographic about your Power-Duration Curve

𝐏𝐨𝐰𝐞𝐫-𝐃𝐮𝐫𝐚𝐭𝐢𝐨𝐧 𝐂𝐮𝐫𝐯𝐞 … 𝐚𝐧 𝐢𝐧𝐟𝐨𝐠𝐫𝐚𝐩𝐡𝐢𝐜

Something different this week.

My posts are usually quite short (200-300 words) and deliberately so.

Bitesize, for easy consumption; each a sequence of 5 posts, building throughout the week.

But this week … pictures!

One infographic per day on the core concepts underpinning Running with Power.

𝐖𝐡𝐲 𝐢𝐧𝐟𝐨𝐠𝐫𝐚𝐩𝐡𝐢𝐜𝐬?

I’m curious to see what AI can create from some handwritten posts.

Curious to discover how it presents the concepts.

Curious to see what it includes (and what it leaves out).

Curious to consider what the infographic says about the way I’ve written the content.

𝐄𝐚𝐜𝐡 𝐝𝐚𝐲 𝐭𝐡𝐢𝐬 𝐰𝐞𝐞𝐤

I’ll post an infographic generated by NotebookLM using the phrase “Please generate an infographic using the selected source” … and for days 2 through 5 I add “in the same style as the previous infographic.”

I’ll also include the URL for the source used for the infographic.

And I’d love to hear from you!

What do you think? Does the picture capture the concept? Does it help with understanding? Is it confusing? Could it be improved?

Today’s URL: https://startrunningwithpower.substack.com/p/want-to-know-your-running-capability

𝑺𝒉𝒐𝒖𝒍𝒅𝒏’𝒕 𝒚𝒐𝒖 𝒃𝒆 𝑹𝒖𝒏𝒏𝒊𝒏𝒈 𝒘𝒊𝒕𝒉 𝑷𝒐𝒘𝒆𝒓?

Questions?
📖 Getting Started

Infographic – Power-Duration Curve

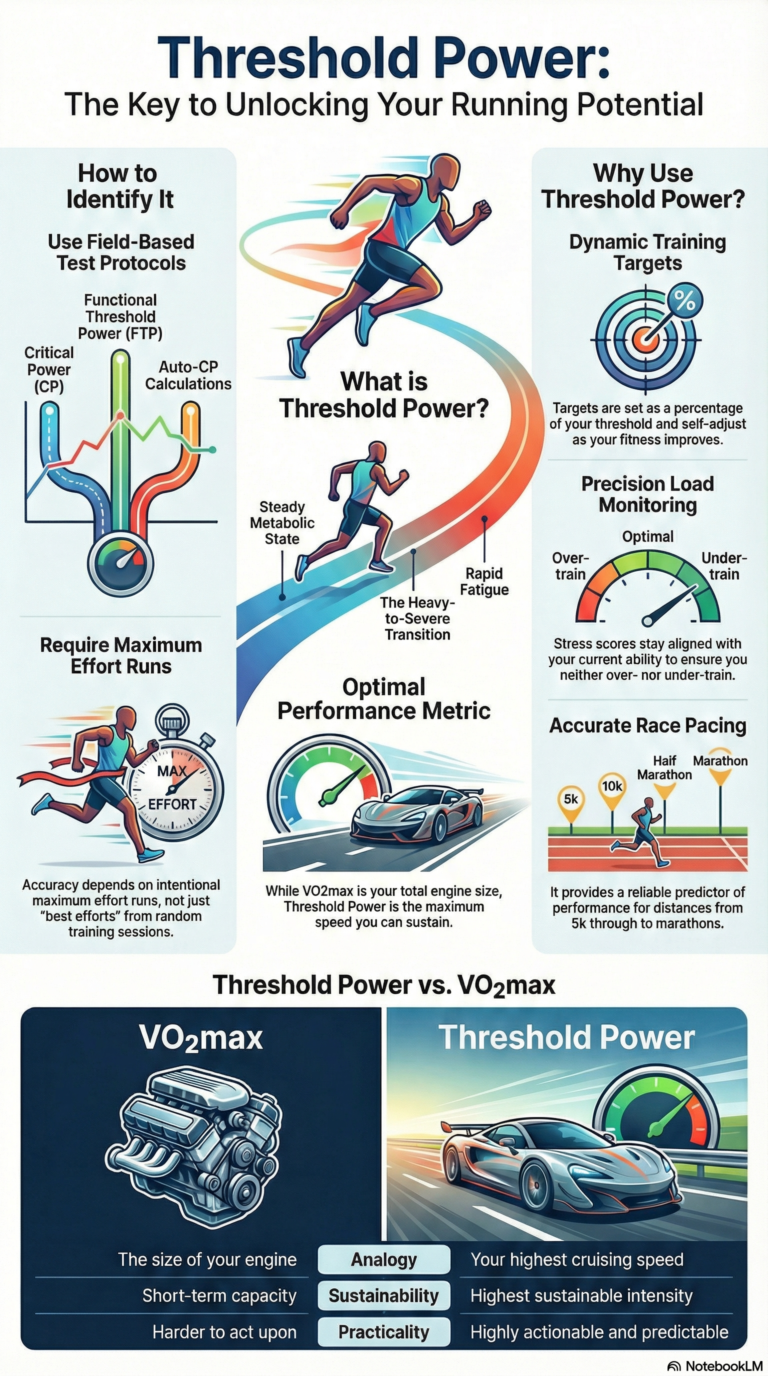
Infographic – Threshold Power

Infographic showing key information about Threshold Power

𝐓𝐡𝐫𝐞𝐬𝐡𝐨𝐥𝐝 𝐏𝐨𝐰𝐞𝐫 … 𝐚𝐧 𝐢𝐧𝐟𝐨𝐠𝐫𝐚𝐩𝐡𝐢𝐜

Something different this week.

My posts are usually quite short (200-300 words) and deliberately so.

Bitesize, for easy consumption; each a sequence of 5 posts, building throughout the week.

But this week … pictures!

One infographic per day on the core concepts underpinning Running with Power.

𝐖𝐡𝐲 𝐢𝐧𝐟𝐨𝐠𝐫𝐚𝐩𝐡𝐢𝐜𝐬?

I’m curious to see what AI can create from some handwritten posts.

Curious to discover how it presents the concepts.

Curious to see what it includes (and what it leaves out).

Curious to consider what the infographic says about the way I’ve written the content.

𝐄𝐚𝐜𝐡 𝐝𝐚𝐲 𝐭𝐡𝐢𝐬 𝐰𝐞𝐞𝐤

I’ll post an infographic generated by NotebookLM using the phrase “Please generate an infographic using the selected source” … and for days 2 through 5 I add “in the same style as the previous infographic.”

I’ll also include the URL for the source used for the infographic.

And I’d love to hear from you!

What do you think? Does the picture capture the concept? Does it help with understanding? Is it confusing? Could it be improved?

Today’s URL: https://startrunningwithpower.substack.com/p/no-need-for-lactate-testing

𝑺𝒉𝒐𝒖𝒍𝒅𝒏’𝒕 𝒚𝒐𝒖 𝒃𝒆 𝑹𝒖𝒏𝒏𝒊𝒏𝒈 𝒘𝒊𝒕𝒉 𝑷𝒐𝒘𝒆𝒓?

Questions?
📖 Getting Started

Infographic – Threshold Power

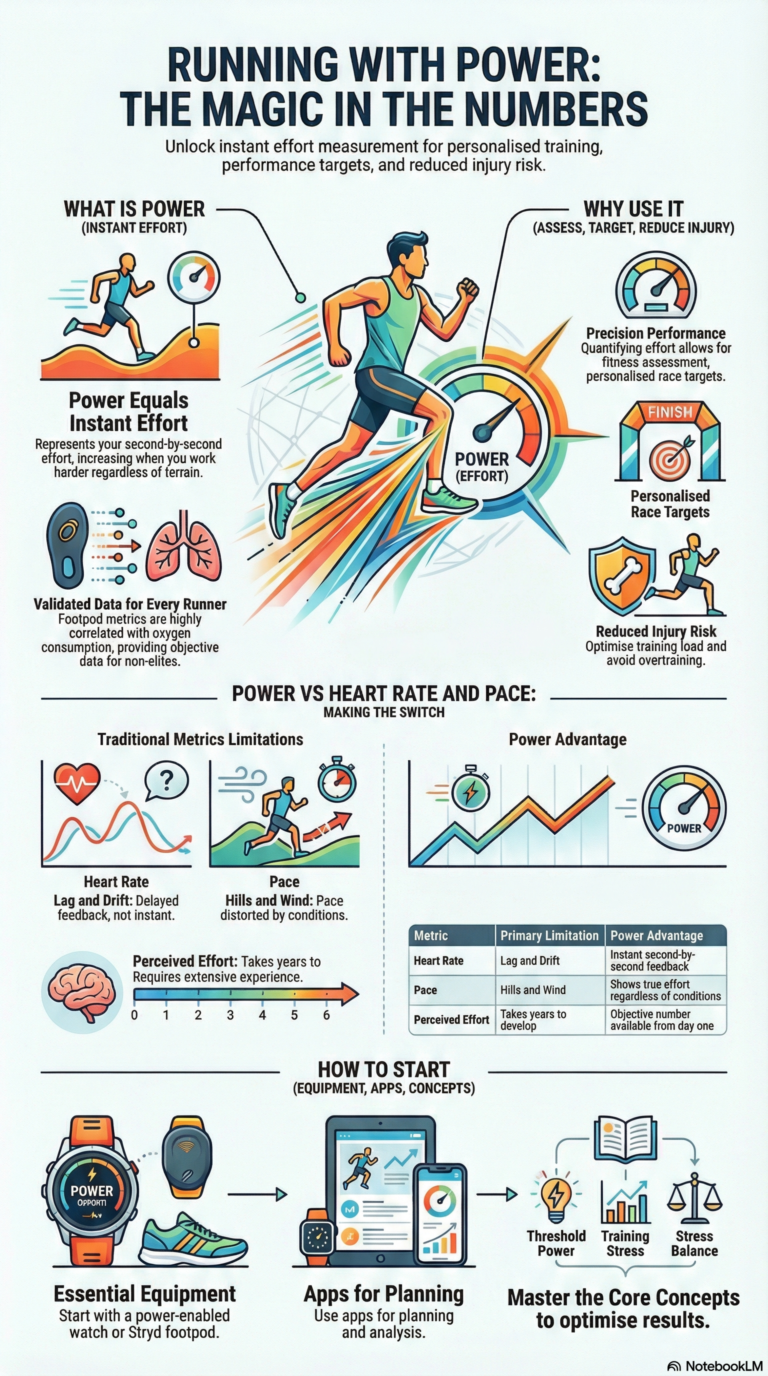
Infographic – Power=Effort

Infographic explaining 'What is Power'

𝐏𝐨𝐰𝐞𝐫=𝐄𝐟𝐟𝐨𝐫𝐭 … 𝐚𝐧 𝐢𝐧𝐟𝐨𝐠𝐫𝐚𝐩𝐡𝐢𝐜

Something different this week.

My posts are usually quite short (200-300 words) and deliberately so.

Bitesize, for easy consumption; each a sequence of 5 posts, building throughout the week.

But this week … pictures!

One infographic per day on the core concepts underpinning Running with Power.

𝐖𝐡𝐲 𝐢𝐧𝐟𝐨𝐠𝐫𝐚𝐩𝐡𝐢𝐜𝐬?

I’m curious to see what AI can create from some handwritten posts.

Curious to discover how it presents the concepts.

Curious to see what it includes (and what it leaves out).

Curious to consider what the infographic says about the way I’ve written the content.

𝐄𝐚𝐜𝐡 𝐝𝐚𝐲 𝐭𝐡𝐢𝐬 𝐰𝐞𝐞𝐤

I’ll post an infographic generated by NotebookLM using the phrase “Please generate an infographic using the selected source” … and for days 2 through 5 I add “in the same style as the previous infographic.”

I’ll also include the URL for the source used for the infographic.

And I’d love to hear from you!

What do you think? Does the picture capture the concept? Does it help with understanding? Is it confusing? Could it be improved?

Today’s URL: https://startrunningwithpower.substack.com/p/what-is-running-with-power

𝑺𝒉𝒐𝒖𝒍𝒅𝒏’𝒕 𝒚𝒐𝒖 𝒃𝒆 𝑹𝒖𝒏𝒏𝒊𝒏𝒈 𝒘𝒊𝒕𝒉 𝑷𝒐𝒘𝒆𝒓?

Questions?
📖 Getting Started

Infographic – Power=Effort

Max efforts are hard – is there any alternative?

Hand raised to ask a question

𝐌𝐚𝐱 𝐄𝐟𝐟𝐨𝐫𝐭 𝐫𝐮𝐧𝐬 𝐚𝐫𝐞 𝐡𝐚𝐫𝐝 – 𝐢𝐬 𝐭𝐡𝐞𝐫𝐞 𝐚𝐧𝐲 𝐚𝐥𝐭𝐞𝐫𝐧𝐚𝐭𝐢𝐯𝐞?

This is a common experience for runners new to power.

A Maximum Effort run is a run at the maximum (average) power you can maintain for a specific duration.

For example, your 3-minute max is the highest average power you can maintain over a 3-minute run.

𝐖𝐡𝐲 𝐝𝐨 𝐭𝐡𝐞𝐦?

👉🏼 By running max efforts over two or more durations (e.g. 3-minutes and 12-minutes) you can calculate your Threshold Power.

❓ Without max efforts, you won’t truly know what you’re capable of, and your training targets, training load and race/event targets will probably be understated.

𝐈𝐬 𝐭𝐡𝐞𝐫𝐞 𝐚𝐧𝐲 𝐚𝐥𝐭𝐞𝐫𝐧𝐚𝐭𝐢𝐯𝐞?

Yes.

💉 You can pay for lactate testing. But this typically involves a graded exercise test with increasing intensity every few minutes (max efforts in disguise).

🧮 You can estimate your Threshold Power using easy runs, but this method is only recommended until you’re able to complete maximum effort runs.

𝐃𝐨 𝐭𝐡𝐞𝐲 𝐠𝐞𝐭 𝐞𝐚𝐬𝐢𝐞𝐫?

They do … and they don’t.

❌ They don’t because you’re running at the highest average power you can manage – that’s never going to be easy. And it’s typical to start out too fast and fade towards the end, which may mean you didn’t really run to your maximum.

✅ And they do. You get used to how they feel. You get used to starting out a little slower, then pushing it towards the end. And you can use previous max effort results to gauge how hard to run the first part of your upcoming max effort.

And then you realise (in the words of Dr Andrew Coggan) ‘testing is training, too’.

𝑺𝒉𝒐𝒖𝒍𝒅𝒏’𝒕 𝒚𝒐𝒖 𝒃𝒆 𝑹𝒖𝒏𝒏𝒊𝒏𝒈 𝒘𝒊𝒕𝒉 𝑷𝒐𝒘𝒆𝒓?

Questions?
📖 Getting Started

Max efforts are hard – is there any alternative?

Power Apps – point solutions

Power apps - calculating metrics

𝐏𝐨𝐰𝐞𝐫 𝐀𝐩𝐩𝐬 – 𝐩𝐨𝐢𝐧𝐭 𝐬𝐨𝐥𝐮𝐭𝐢𝐨𝐧𝐬

Power is still relatively new for runners. And while there are some apps that cover most of the important metrics, you may find that you need additional apps to plug the gaps.

Here are a few apps that can fill those gaps.

𝐔𝐬𝐢𝐧𝐠 𝐀𝐩𝐩𝐥𝐞 𝐰𝐫𝐢𝐬𝐭-𝐛𝐚𝐬𝐞𝐝 𝐩𝐨𝐰𝐞𝐫

Apple Health doesn’t provide any of the important metrics.

Which means you’ll need to transfer your workout data from Apple Health into an app that can provide these, like WKO or Intervals.icu.

There are a few apps that will do this. I’ve successfully used HealthFit; other options are RunGap or Health Sync.

𝐑𝐮𝐧𝐧𝐢𝐧𝐠 𝐄𝐟𝐟𝐞𝐜𝐭𝐢𝐯𝐞𝐧𝐞𝐬𝐬 (𝐑𝐄)

The only app to provide this (natively) is WKO.

If you’re a Stryd user, or if you’re using Intervals.icu, you’ll need to calculate RE manually or use SuperPower Calculator for Sheets (SPCs).

Steve Palladino’s video ‘Running Effectiveness and the SuperPower Calculator’ demonstrates how to use SPCs to calculate RE for a workout or a workout section.

𝐎𝐭𝐡𝐞𝐫 𝐚𝐩𝐩𝐬

‘Getting Started’ covers other apps that can calculate power metrics, while the book’s online content provides a more complete comparison of Power Apps.

𝑺𝒉𝒐𝒖𝒍𝒅𝒏’𝒕 𝒚𝒐𝒖 𝒃𝒆 𝑹𝒖𝒏𝒏𝒊𝒏𝒈 𝒘𝒊𝒕𝒉 𝑷𝒐𝒘𝒆𝒓?

Questions?
📖 Getting Started

point solutions

Power Apps – Intervals.icu

Power apps - calculating metrics

𝐏𝐨𝐰𝐞𝐫 𝐀𝐩𝐩𝐬 – 𝐈𝐧𝐭𝐞𝐫𝐯𝐚𝐥𝐬.𝐢𝐜𝐮

Intervals.icu analyses your rides, runs, swims and other activities (with and without power). It provides basic and advanced analytics and planning in an easy-to-use web interface with support for desktops, phones, and tablets. Intervals.icu is free to use, with additional features should you choose to subscribe.

It can calculate and display all the most important metrics … and then some.

𝐈𝐧𝐭𝐞𝐫𝐯𝐚𝐥𝐬.𝐢𝐜𝐮 𝐌𝐞𝐭𝐫𝐢𝐜𝐬

✅ Threshold Power. Intervals.icu can calculate threshold power (using your choice from several models) based on the last 90 days of completed workouts or using a custom date range.

✅ Stress Score. Intervals.icu uses the term ‘Training Stress Score’ (TSS) and can calculate a power-based TSS for each completed workout.

✅ Stress Balance. Intervals.icu uses the term ‘Form’ to show the balance between ‘Fitness’ and ‘Fatigue’.

✅ Ramp Rate. Intervals.icu shows your week-on-week Ramp Rate (RR), overlaid onto the same chart as fitness, fatigue and form.

✅ Running Effectiveness. Intervals.icu doesn’t calculate Running Effectiveness, although you can manually calculate this using the detailed workout review pages, or by adding a custom calculation.

𝐖𝐡𝐲 𝐮𝐬𝐞 𝐈𝐧𝐭𝐞𝐫𝐯𝐚𝐥𝐬.𝐢𝐜𝐮?

If you’re not using the Stryd ecosystem or TrainingPeaks/WKO, Intervals.icu is a great way to track your power metrics.

Getting Started’ covers other apps that can calculate power metrics, while the book’s online content provides a more complete comparison of Intervals.icu vs. other Power Apps.

𝑺𝒉𝒐𝒖𝒍𝒅𝒏’𝒕 𝒚𝒐𝒖 𝒃𝒆 𝑹𝒖𝒏𝒏𝒊𝒏𝒈 𝒘𝒊𝒕𝒉 𝑷𝒐𝒘𝒆𝒓?

Questions?
📖 Getting Started

WKO

Intervals.icu

Power Apps – WKO

Power apps - calculating metrics

𝐏𝐨𝐰𝐞𝐫 𝐀𝐩𝐩𝐬 – 𝐖𝐊𝐎

The WKO app is an analysis and charting tool that runs under MS Windows or on a Mac and provides a wide range of charts and graphs of your power data.

It can calculate and display all the most important metrics … and then some.

𝐖𝐊𝐎 𝐌𝐞𝐭𝐫𝐢𝐜𝐬

✅ Threshold Power. WKO uses the term ‘Functional Threshold Power’ (FTP) and offers an automatically calculated FTP, as well as the option to manually record your FTP history (and use it in charts).

✅ Stress Score. WKO uses the term ‘Training Stress Score’ (TSS).

✅ Stress Balance. WKO uses the term ‘Training Stress Balance’ (TSB).

✅ Ramp Rate. WKO can chart your week-on-week Ramp Rate (RR).

✅ Running Effectiveness. WKO can show your Running Effectiveness (RE) for an entire workout or just for part of a workout (e.g. an interval).

𝐖𝐡𝐲 𝐮𝐬𝐞 𝐖𝐊𝐎?

WKO comes with hundreds of pre-configured charts. You can also build your own charts and calculated metrics using a powerful charting language. WKO integrates seamlessly with TrainingPeaks, syncing planned and completed workout data and a range of health metrics.

Getting Started’ covers other apps that can calculate power metrics, while the book’s online content provides a more complete comparison of WKO vs. other Power Apps.

𝑺𝒉𝒐𝒖𝒍𝒅𝒏’𝒕 𝒚𝒐𝒖 𝒃𝒆 𝑹𝒖𝒏𝒏𝒊𝒏𝒈 𝒘𝒊𝒕𝒉 𝑷𝒐𝒘𝒆𝒓?

Questions?
📖 Getting Started

Power Apps – Stryd PowerCenter / Stryd Mobile

Power apps - calculating metrics

𝐏𝐨𝐰𝐞𝐫 𝐀𝐩𝐩𝐬 – 𝐒𝐭𝐫𝐲𝐝 𝐏𝐨𝐰𝐞𝐫𝐂𝐞𝐧𝐭𝐞𝐫 / 𝐒𝐭𝐫𝐲𝐝 𝐌𝐨𝐛𝐢𝐥𝐞

The Stryd PowerCenter / Mobile app is available to anyone using a Stryd footpod (most features are free, some need a subscription).

It calculates and displays some (but not all) of the most important metrics.

𝐒𝐭𝐫𝐲𝐝 𝐌𝐞𝐭𝐫𝐢𝐜𝐬

In the following, the term ‘Stryd’ includes Stryd PowerCenter and Stryd Mobile

✅ Threshold Power. Stryd uses the term ‘Critical Power’ (CP) and offers an automatically calculated CP (Auto-CP) as well as a manually-set CP (using various protocols).

✅ Stress Score. Stryd uses the term ‘Running Stress Score’ (RSS) and offers a unique calculation which includes a term representing the additional biomechanical stress put on your body from running (vs. cycling).

✅ Stress Balance. Stryd uses the term ‘Running Stress Balance’ (RSB) and offers guidance for how to interpret your RSB.

❌ Ramp Rate. Stryd does not show your Ramp Rate (RR). You’ll need to calculate RR manually using Stryd’s 42d Avg (in Stryd Mobile) or use another system to track this.

❌ Running Effectiveness. Stryd does not show your Running Effectiveness (RE). You’ll need to calculate RE manually using another system, or use one of Stryd’s alternate metrics – for example Form Power, Leg Spring Stiffness, Impact Loading Rate.

𝐖𝐡𝐲 𝐮𝐬𝐞 𝐒𝐭𝐫𝐲𝐝 𝐏𝐨𝐰𝐞𝐫𝐂𝐞𝐧𝐭𝐫𝐞 / 𝐌𝐨𝐛𝐢𝐥𝐞?

The Stryd ecosystem is probably the most power-friendly app at the moment, designed with power in mind, and aimed at runners who are getting started with power.

Getting Started’ covers systems that can calculate the missing metrics, while the book’s online content provides a more complete comparison of Stryd vs. other Power Apps.

𝑺𝒉𝒐𝒖𝒍𝒅𝒏’𝒕 𝒚𝒐𝒖 𝒃𝒆 𝑹𝒖𝒏𝒏𝒊𝒏𝒈 𝒘𝒊𝒕𝒉 𝑷𝒐𝒘𝒆𝒓?

Questions?
📖 Getting Started

⏪ Choosing Power Apps

Stryd PowerCenter / Stryd Mobile

WKO