

What are you capable of?
This is a subtle question, as the answer depends on:
❓ how hard you run – your effort
❓ how long you can sustain that effort
❓ how well you’re able to convert that effort into forward motion
Your Power-Duration Curve (PDC) can help answer the first two – the third depends on your Running Effectiveness.
Modelling your PDC
The higher your power (your effort), the shorter the duration you can sustain it; the lower your power, the longer you can sustain it.
In other words, there’s an inverse relationship between power and duration.
You can chart this relationship. The result is a chart showing your Mean-Max Power (MMP) – the best effort you can sustain for each duration (measured using average power for each).
Based on your MMP, your PDC models your best efforts over a range of different durations, showing (for each) the effort you could sustain.
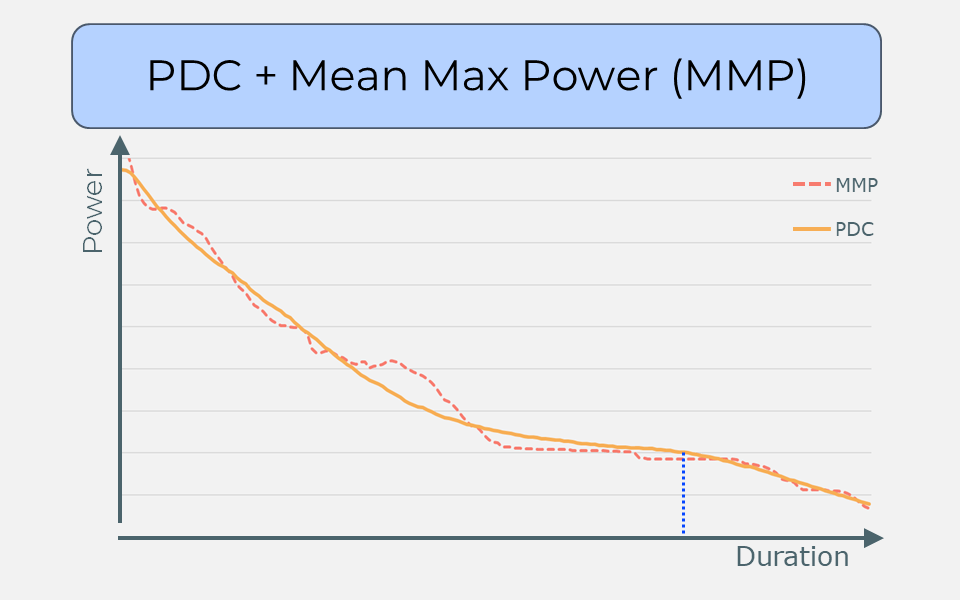
The chart shows a typical PDC (the orange line) based on a typical MMP (the red dotted line).
It’s usually charted using a duration scale that expands the left side of the curve and compresses the right side, revealing that the PDC is actually two separate curves.
Your PDC is actually a Fatigue-Resistance Curve
How long you can sustain a particular effort level depends on how much you can do before tiring – it depends on how you fatigue.
Fatigue has two components: a fast component and a slow component.
Both elements of fatigue are always present, but the fast element of fatigue dominates at higher intensities, and the slow element dominates at lower intensities.
These are the two curves that, together, make up the PDC.
For more information on the PDC (as implemented in WKO), see ‘Scientific Basis of the New Power Duration Model in WKO4‘.
Topic: Power-Duration Curve
⏩ You fatigue faster at higher intensities